3D
3D Volume
Volumetric view to interpret spatial distribution, depth and critical zones.
A technical-operational dashboard to visualize the hydraulic condition of heap leaching piles through 3D, 2D maps, vertical tomography-like cuts, critical sections, KPIs, severity and temporal analysis.
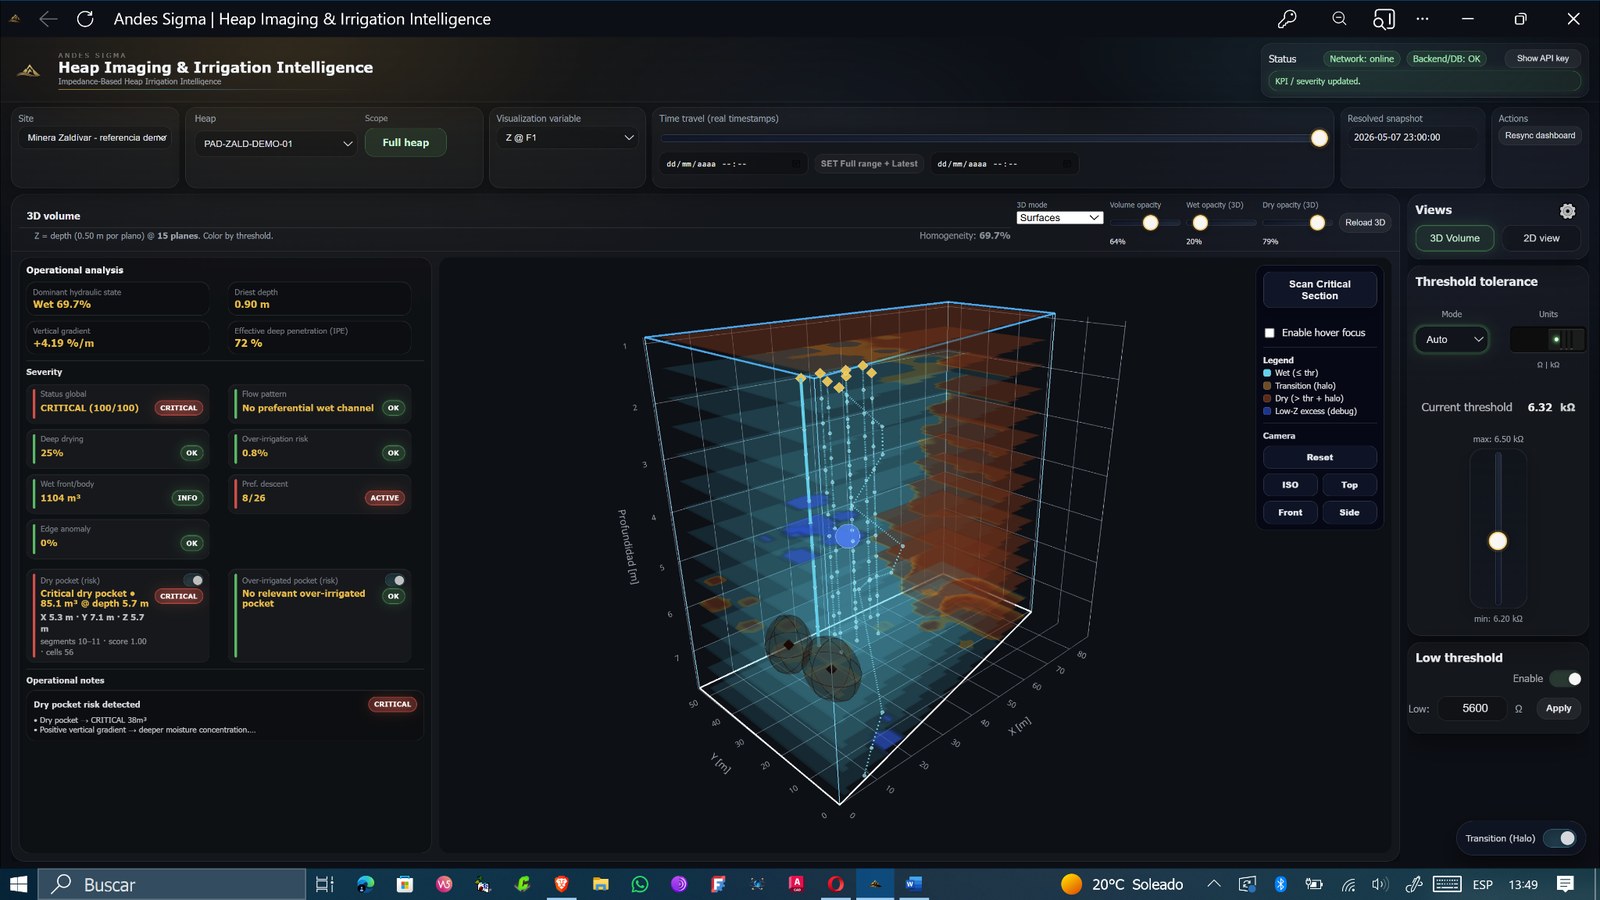
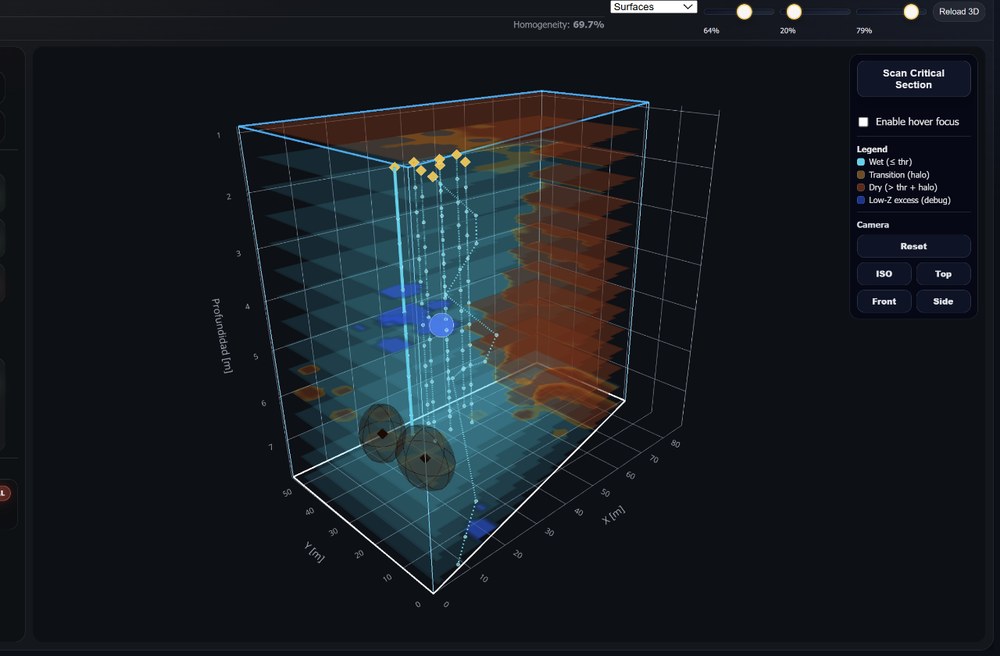
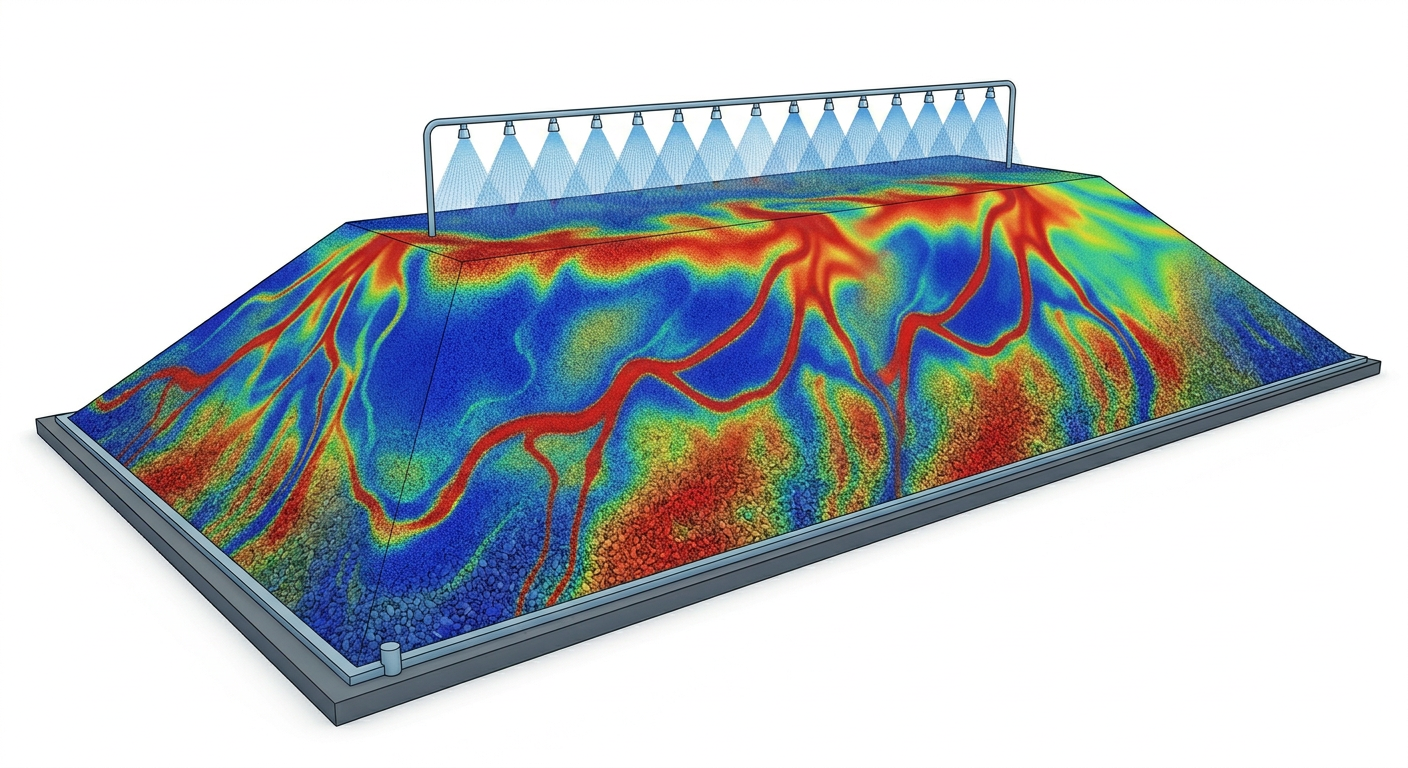
Spatial representation of relative wet, dry, transition and critical phenomena.

Selection of real snapshots, KPI recalculation and evolution tracking.
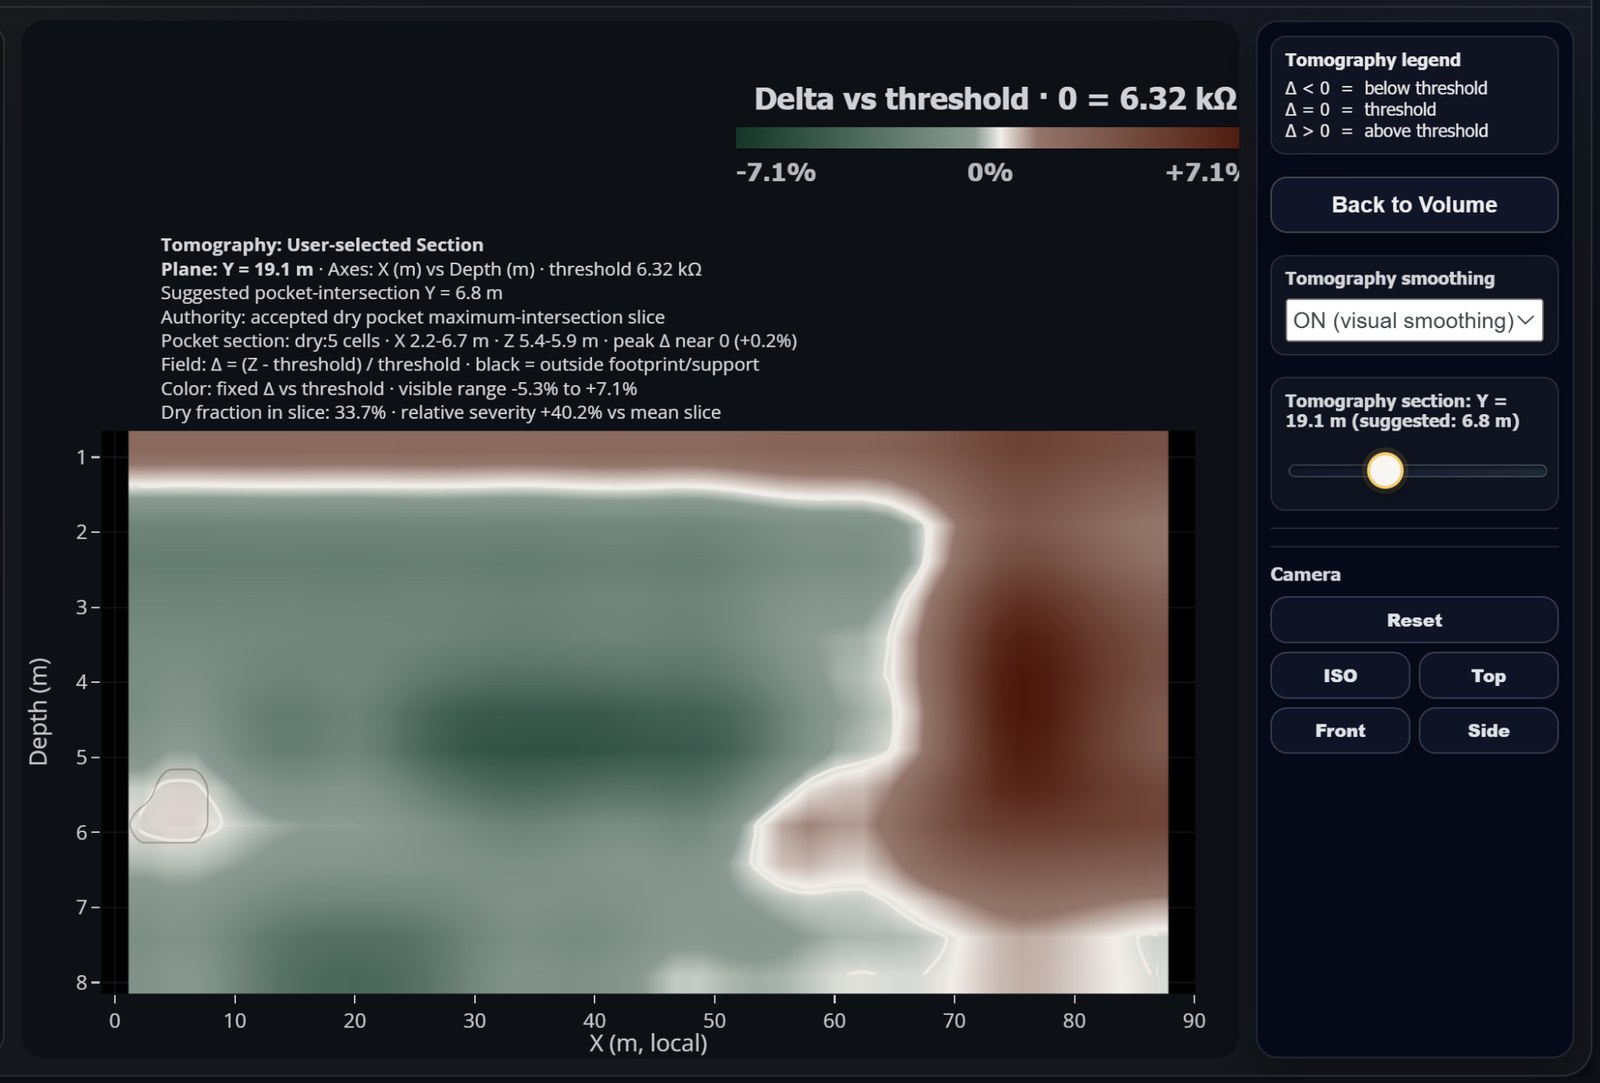
Operational tomography
The vertical cut view helps analyze continuity, depth and transition of the hydraulic condition. The platform can initially focus on the most deficient or problematic irrigation section and then allow manual cross-section exploration along the heap.
Modules
The platform organizes real measurements into interpretable views and diagnostic controls.
Volumetric view to interpret spatial distribution, depth and critical zones.
Depth maps to review specific measurement planes.
Critical sections to study continuity, depth and internal phenomena.
KPIs, severity, operational notes and detected phenomena.
Thresholds and tolerances for comparative impedance and hydraulic condition reading.
Historical snapshots and temporal evolution comparison.
Not only visualization
The dashboard aims to translate technical measurements into actionable information for operation, metallurgy, hydrometallurgy, operational control and mining innovation teams.